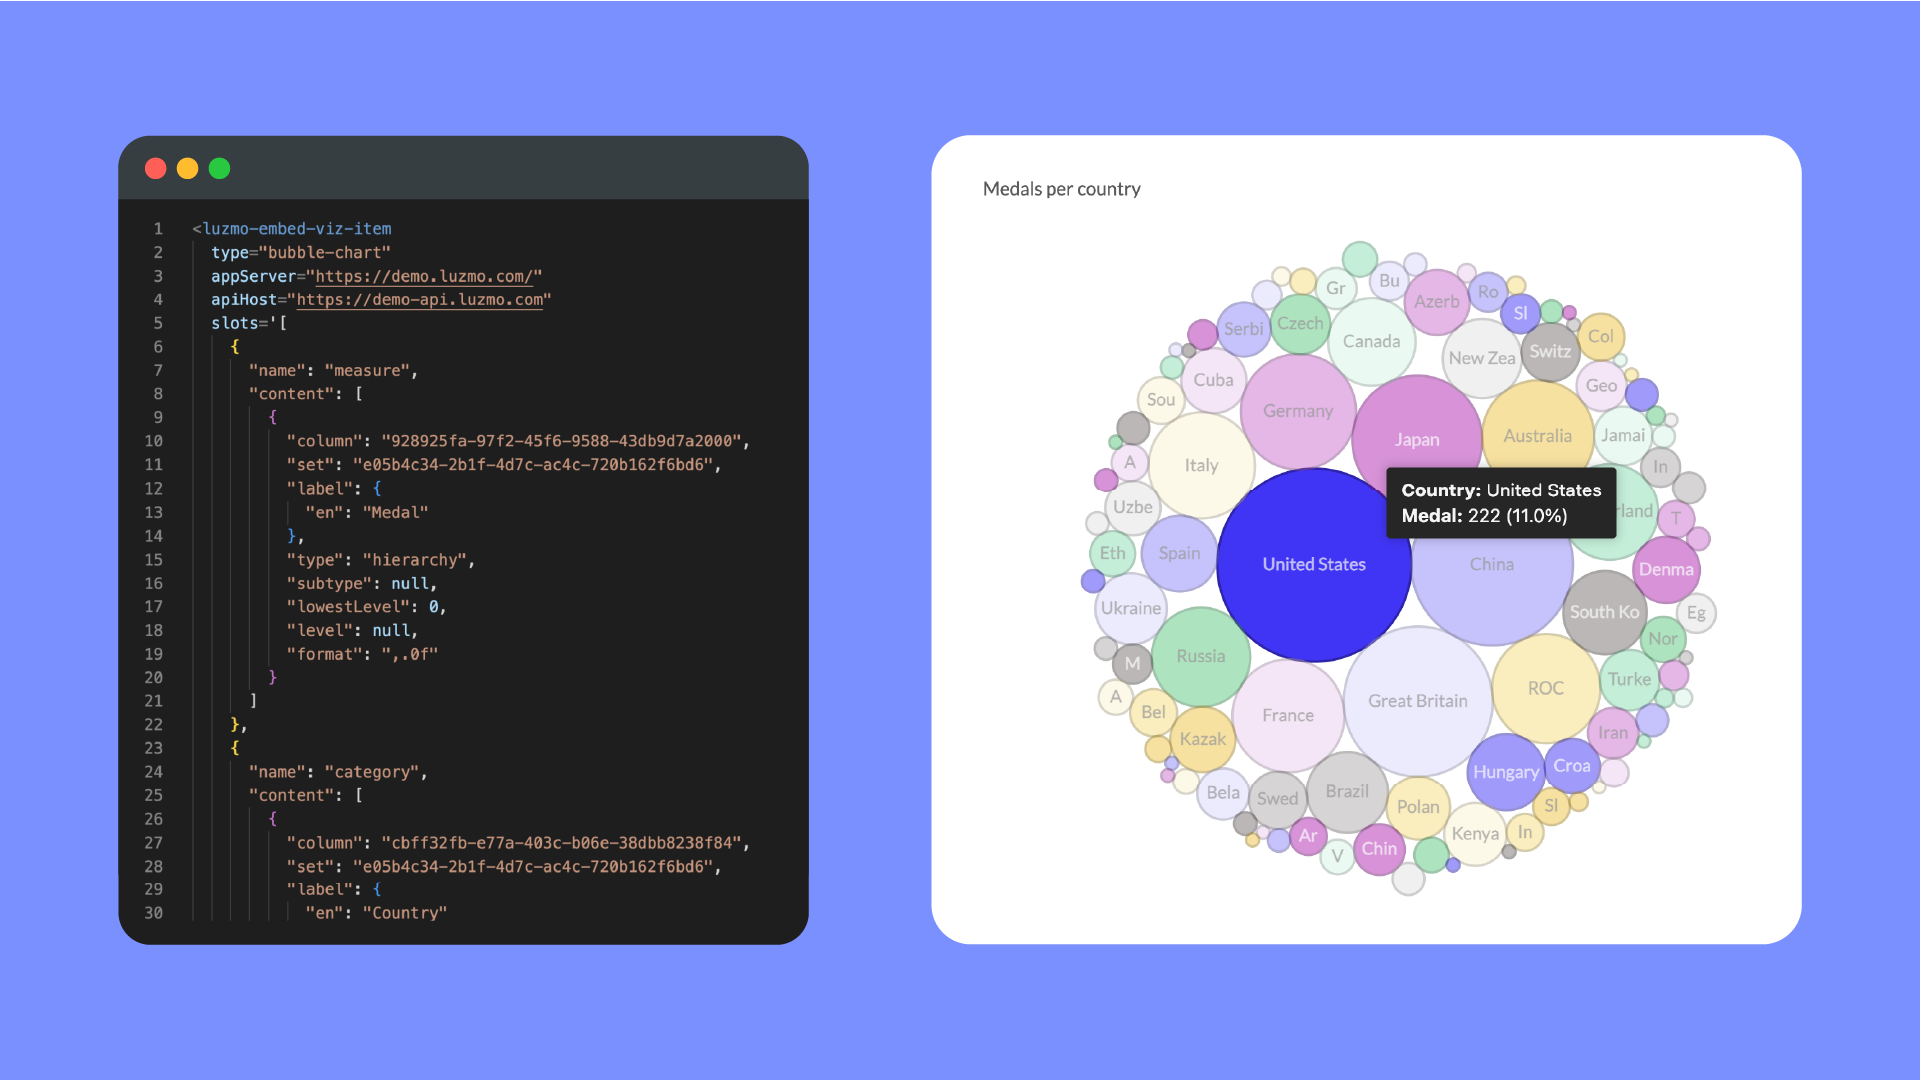
Flex SDK
Creating visually appealing and interactive data visualizations can be a daunting task. Most easy-to-use graph building software falls short in providing the flexibility and customization required for complex data products. Problems often include:
- Your users may find it challenging to interact with the visualizations in meaningful ways.
- The visualizations may not be tailored to specific user needs or preferences.
- Customization options may be limited, making it difficult to create unique and engaging visualizations.
- Handling a large number of concurrent users can be problematic for some tools.
- Integrating visualizations with existing components of your application can be complex.
Building custom chart libraries from scratch provides flexibility and customization, but is often not feasable due to the time-consuming and resource-intensive process of developing these custom chart libraries.
Introducing Luzmo Flex

Luzmo Flex is a powerful SDK add-on for data visualization that combines the flexibility of code-first development with a wide range of integration options. It empowers developers to:
- Build custom charts programmatically: Create unique and tailored visualizations directly through code.
- Integrate deeply with web components: Deliver a seamless and native user experience by embedding visualizations within web applications.
- Combine with external web components: Create highly customized and interactive data products by integrating Luzmo charts with other web components.
- Personalize the experience: Adapt visualizations based on user preferences, role, language, and other factors.
- Leverage out-of-the-box tools: Benefit from built-in features such as localization, optimal data querying, and advanced filtering.
It's important to note that Luzmo Flex is not a tool for creating new chart types but instead an SDK to programmatically create and configure the charts available within Luzmo on runtime. When using Flex, you do not need to build query optimization, data access control, or complex data connections from scratch since they are provided natively by the Luzmo platform. The Luzmo API may also be leveraged to configure through code data connections and other customizations. Technical details may be found in our developer documentation.
While our core platform provides an intuitive interface for creating charts, configuring datasets, and embedding dashboards, Luzmo Flex offers a more code-centric approach. It allows developers to seamlessly integrate charts within their applications through code, providing greater flexibility and control.
Examples
You may find several showcases on the usage of Flex as well their code here.
For example, the Report Builder uses Luzmo Flex to build an application where end-users can easily create custom reports. Flex's ability to define and modify chart properties on runtime makes it easy to quickly create dashboards tailored to specific user needs. For example, users can easily configure charts, switch chart types, and customize other settings to create reports that meet their exact requirements.
Using Flex
Technical details may be found in our developer documentation. Luzmo Flex is available as a separate add on. Contact our sales team via hello@luzmo.com or our Customer Success team via cs@luzmo.com to find out more.