Query caching
The data in your dashboard is live in case it is coming from a database or plugin. This means that new queries are being fired every time you open the dashboard or play around with its filters.
If you want to enhance the performance of your dashboard, meaning that the results load faster, you can activate query caching. This might be desired for embedded dashboards and can be activated for databases, plugins but also for some of the web services.
What is query caching?
Query caching means that the results of the query are being kept in cache during a given period of time, during which identical queries will be served from this cache. You could also call this a memory.
Important to know is that caching is about the exact same query, so not the full dataset. You can activate this on the dataset or database level.
The query results that get cached are based on the query as sent to our API (i.e. when loading a specific dashboard this would be the query for a specific chart), this doesn't necessarily match 1 to 1 to the query sent to the data source.
It is possible that the Luzmo query layer requests a less narrow set of data and the data returned is processed into the final result by the Luzmo query layer. The final result is what will be cached. For example it is possible that queries for different charts get grouped together before being sent to the data source, or certain elements such as joins, distinct counts, ... are not pushed down to the data source (depending on the capabilities of the data source and connector used).
Let’s say that you activate cache for 60 minutes, during which the results of your query after opening your dashboard for the first time will be kept in memory. If you re-open the dashboard or play around with filters during these 60 minutes, the data will come from this cache. If nothing happens after these 60 minutes, the cache will be cleared and stays empty. Only after a user opens the dashboard again, a new query is fired which will be kept in cache again. This means that caching is based on queries triggered by users.
How to activate caching?
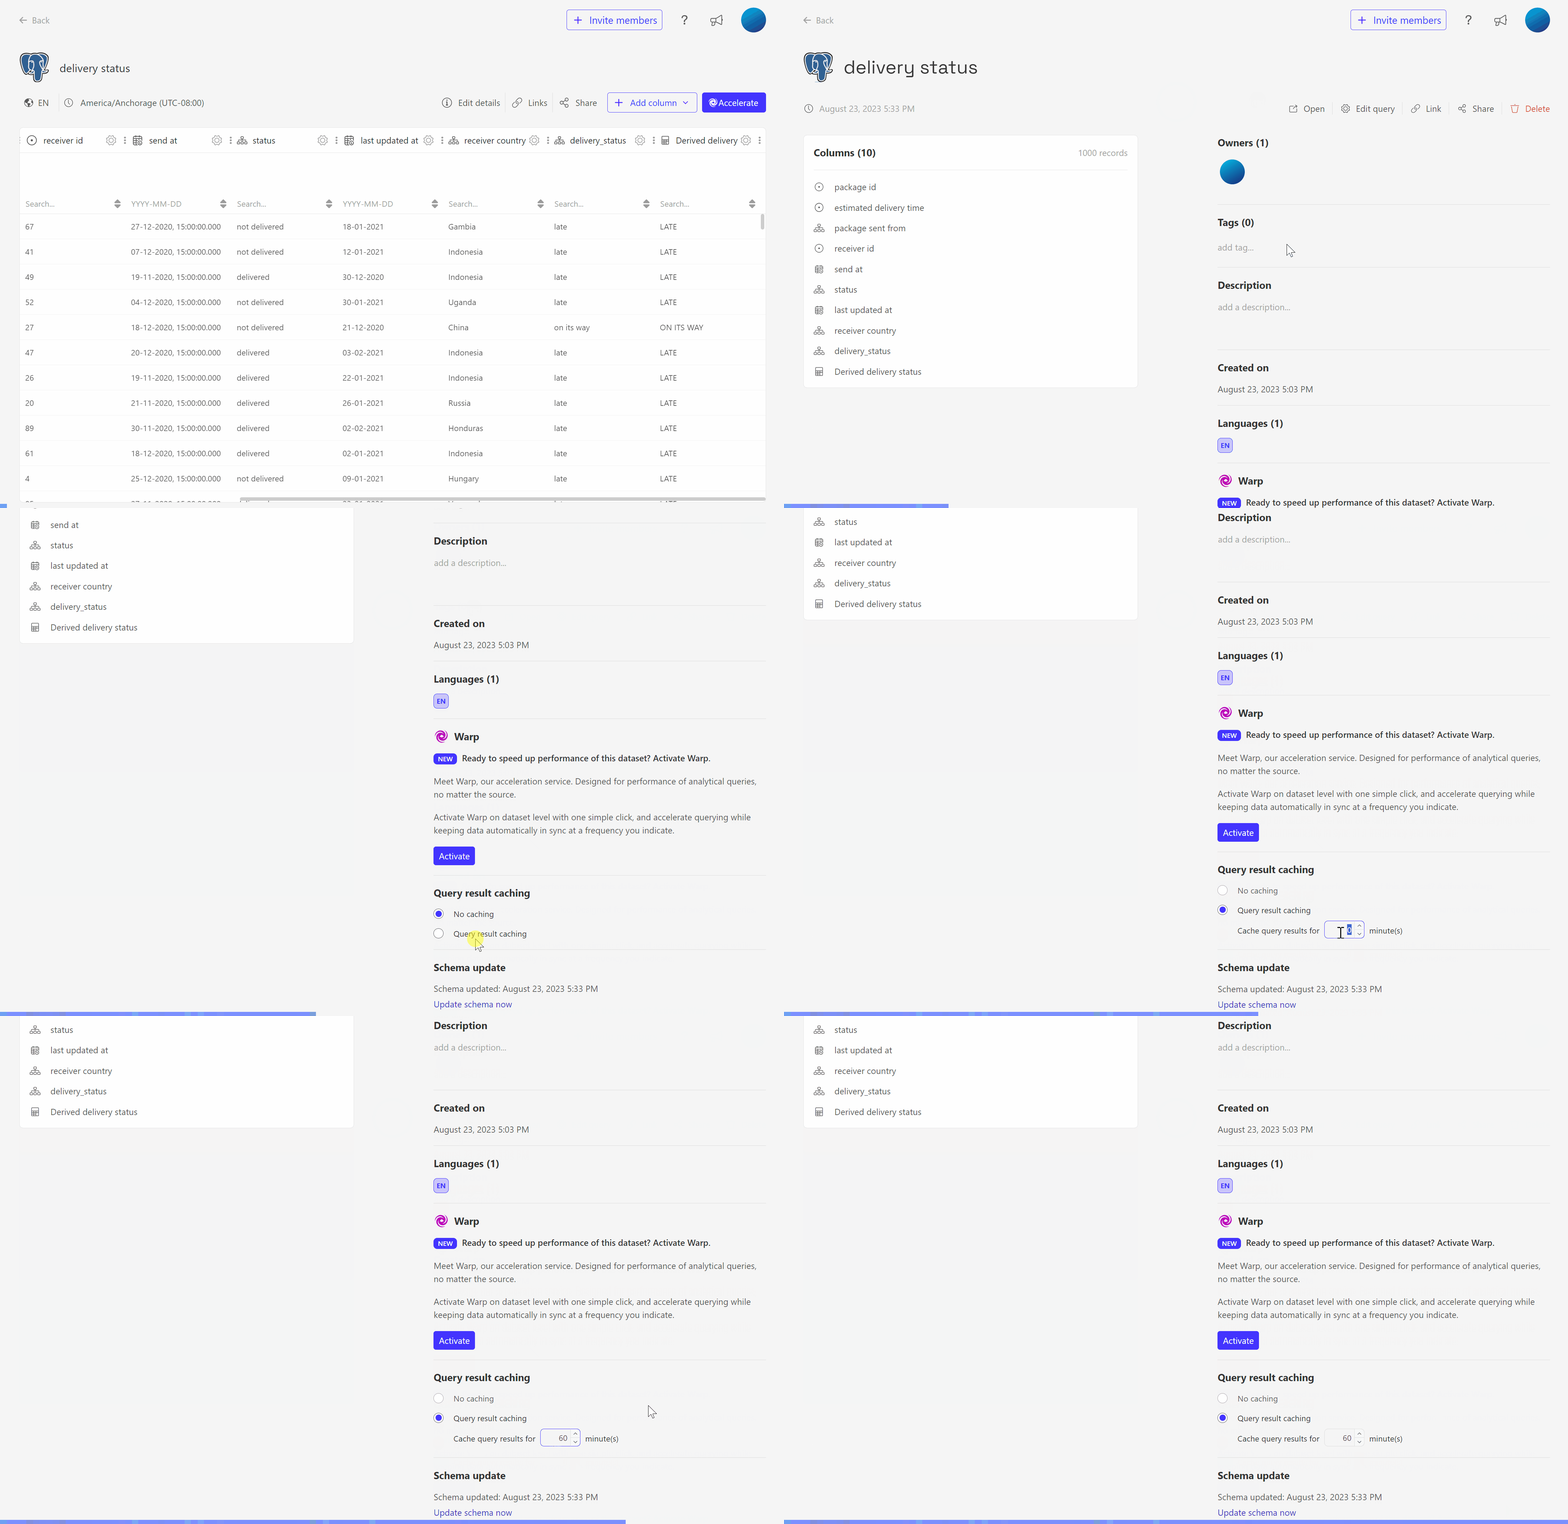
It is very easy to activate caching for your dataset in Luzmo. This is done in the details of the dataset, as you can see in the illustration below.

You can also activate query caching on the connection. Each dataset served by this connection will then have query cache enabled. See this example in our developer docs to understand how to activate query cache on a connection.
Advantage of caching
The most important advantage of caching is that your dashboards will load much faster since the results can come from memory instead of firing queries to your database every time. This is advised for embedded dashboards to give your viewers an excellent experience.
Know that you can check out the query performance per chart via the performance indicator. This gives you an idea on the time needed for every part of the process to get results. Want to know more about this? Check out this article.
Data segregation for query caching
Our query result cache caches based on unique queries sent, and takes into account:
- the query
- the user (Embed (Embedded) tokens)
- metadata added on the token ("metadata" property)
- Parameter filters (newer mechanism) ("metadata" property)
- Token filters (oldest mechanism) ("filters" property)
- Connection overrides ("account_overrides" property)
Warp Vs Query Caching
Warp synchronizes your entire dataset into a data store hosted by Luzmo. Once synchronized, queries to populate a dashboard are launched against this data store. The dataset is kept in sync based on the frequency interval defined.
Query caching stores the results of specific queries for a specified amount of time. It does not store entire datasets. It is possible that query cache is empty upon the first load of a dashboard by a specific user, at which time the query will be launched against your data source. When the same query is launched within the time frame defined for the query cache, the result will be served from this cache.
Don’t hesitate to reach out to us if you have any questions left on this topic. We’re always happy to help you out!