Use "having" filters to hide chart data below a specified result threshold
When you display aggregated data, you may want to only show data if there is a minimum number of data to report on. Most often you will want to do this out of anonymity concerns. You may want to not show certain categories in a chart when they have less than the minimum number, or you may want to hide an entire chart or even dashboard. This article explains how each of those setups can be achieved, and explores an example case where you want to hide the data in a chart when your survey data has more than 10 responses.
Choosing the right filter for your use case
What we want to do is display certain data in charts, aggregated and filtered as we wish, BUT only show that data if there are a certain minimum amount of records that that data is based upon. To do so, we will set op a "post aggregation filter" (also called "having filter") using an aggregation formula.
There are the 2 choices to make regarding the aggregation formula:
1. What should it count?
- COUNT(colum_name) counts only records that have a value in the column.
- COUNTR() (count rows in full) counts every record in the dataset, including those without a value in certain columns.
The recommendation is to use "count rows" when the rule is about the dataset and "count column" when it's about a specific answer.
2. What should the scope be?
- FULL ignores the chart's dimensions and counts over the full dataset after filters. The post aggregation filter will become all-or-nothing: either the number is higher than the threshold and the whole chart (or dashboard) shows, or the query returns no rows and the chart (or dashboard) shows "No data".
- GROUPED counts per chart dimension after filters, chart dimensions that pass the threshold will show in the chart, those that don't will be filtered out and not show.
The four combinations
Each combination of the two choices above answers a different question. Pick one and create it as an aggregation formula on your dataset:
| Formula | Counts | Scope | Effect |
|---|---|---|---|
COUNTR() |
Rows | Grouped | Drops individual groups with too few records. Groups below the threshold disappear; the other groups stay. Shows "No Data" on the chart(s) if all groups are dropped |
COUNT(column_name) |
Column | Grouped | Drops individual groups with too few values for a specific column. Groups below the threshold disappear; the other groups stay. Shows "No Data" on the chart(s) if all groups are dropped |
GROUPFULL(COUNTR()) |
Rows | Full | Shows "No Data" on the chart(s) when the dataset has too few records |
GROUPFULL(COUNT(column_name)) |
Column | Full | Shows "No Data" on the chart(s) when the dataset has too few values for a specific column |
Example case
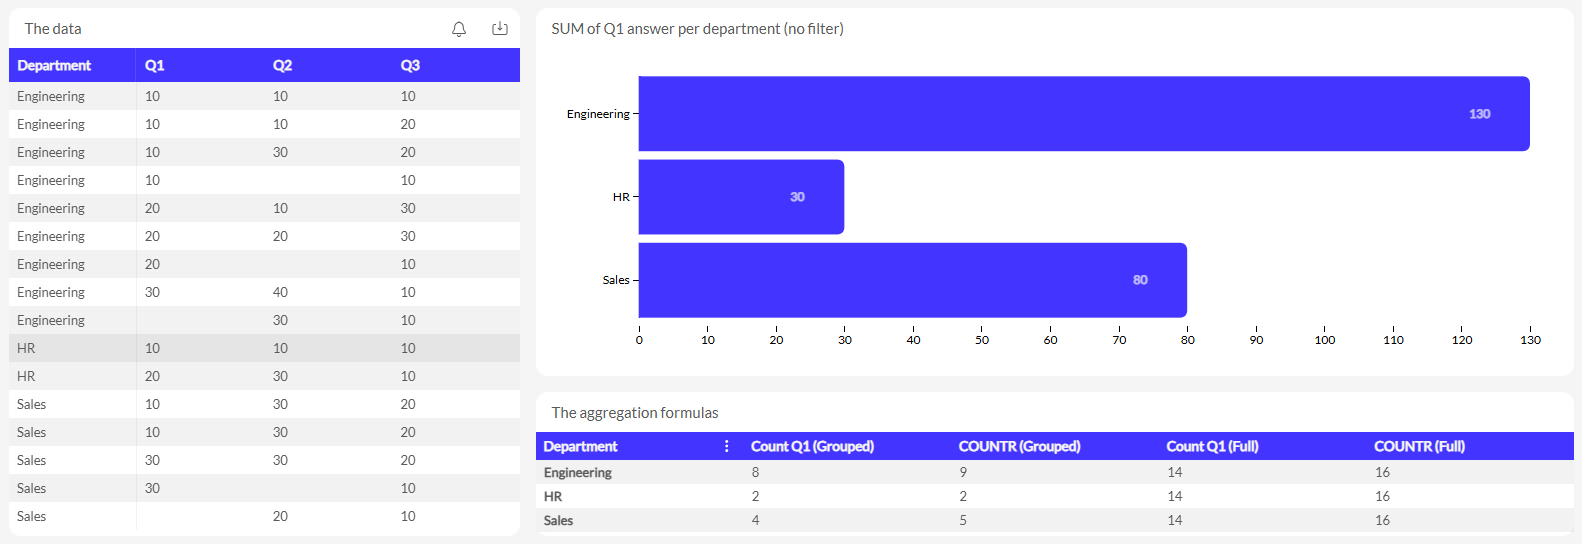
Let's explore an example case where three departments (engineering, sales & HR) filled in a questionnaire with 3 questions. As you can see, some people left some questions blank. This means a COUNT(column_name) on for example the Q1 column will give a different number than the COUNTR. Below screenshot shows the data, the calculation of each of the aggregation formula options (the 4 combinations mentioned above) and a chart with the sum of the answers on Q1 for each department.
If we use those aggregation formulas as a "post aggregation formula" on the chart from above screenshot, depending on the formula and threshold used, different groups of data (or entire charts) do / do not show.
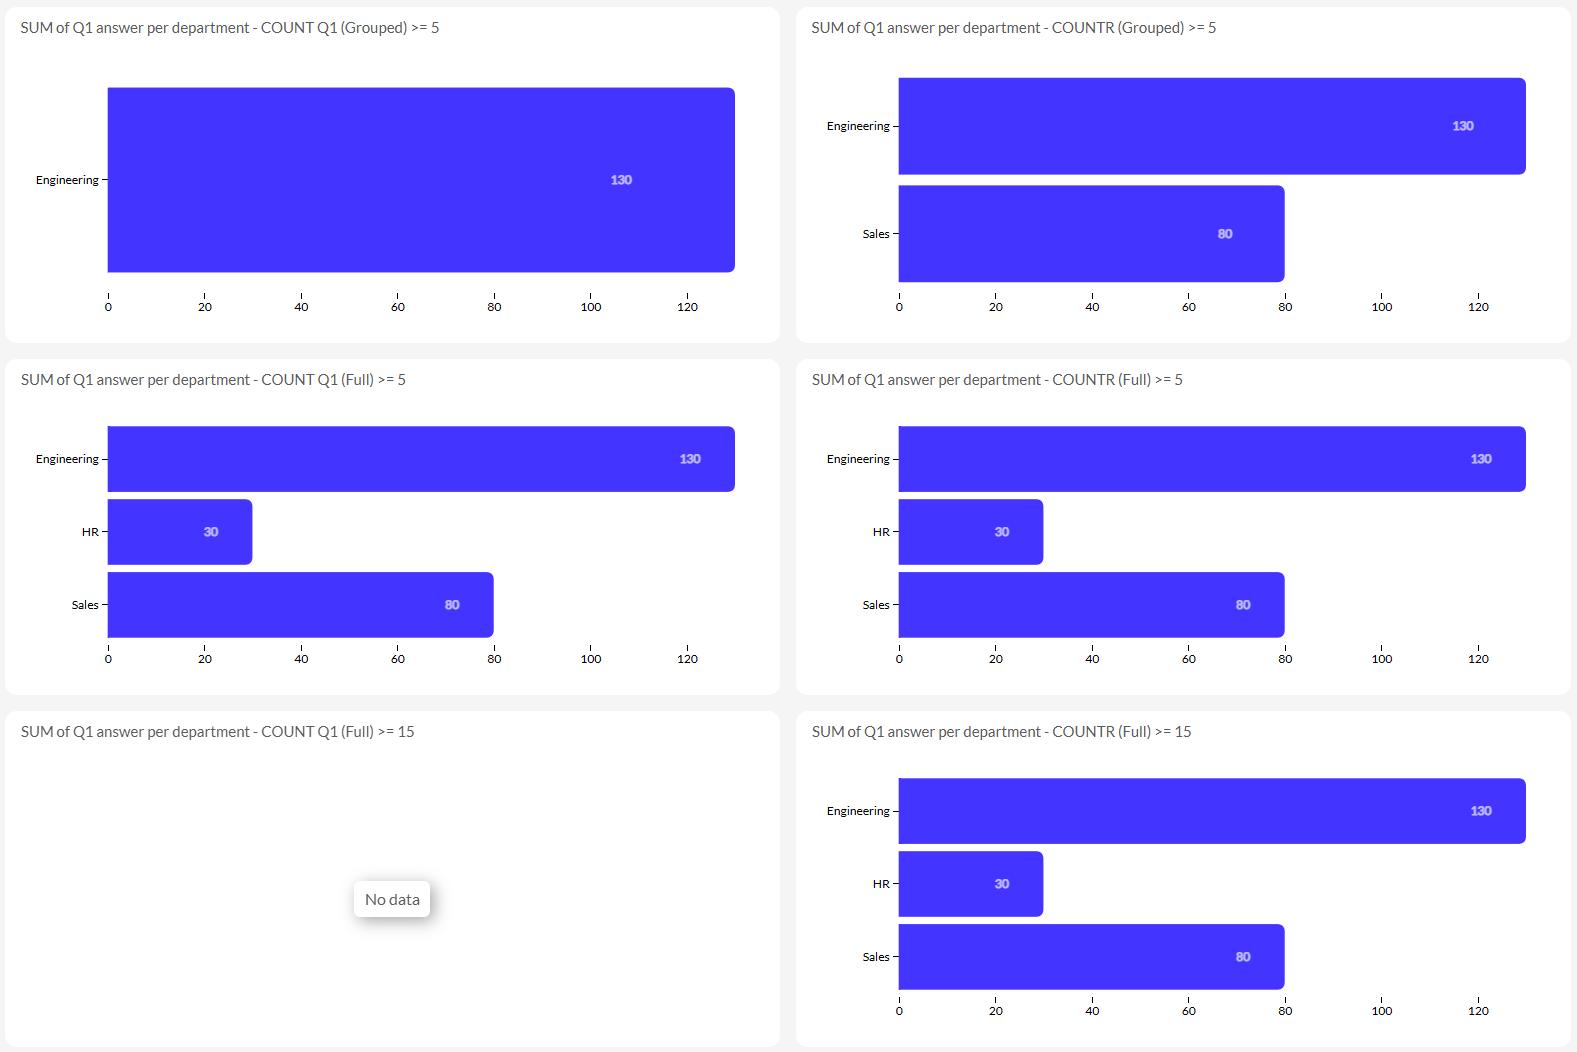
As you can see:
- the count: when using count(Q1) the fact whether not certain people answered Q1 matters. While when using COUNTR this does not matter, instead the number of people who filled in the survey is what matters.
- scope: when using GROUP scope, certain departments may or may not show. While when we use FULL scope, the entire chart does or does not show.
Configuring the formula
Check out the article on aggregation formulas to find out how to configure the formula. If desired, you can also create it via the API or skip the creation step and add it "ad hoc" to your embed token (see section below).
Configuring the post aggregation filter
Via the Luzmo UI
To add a post aggregation formula, click the "Edit" button of a chart and open "Filters". In the "Manage Filters" modal, click "Add Filter" in the "Post-aggregation Filters" section and select your aggregation formula plus configure the threshold (e.g. greater than or equal to 5). The video below shows these steps.
Via the API (embed token)
When you want to change the threshold on a user by user basis, it is advised to set up the filter on the embed token as you can then programatically change it as desired. It can be added as a "having" filter on the embed token
Using an existing aggregation formula as having filter
Below example sets a post aggregation formula on a certain chart. To set it on the entire dashboard, use origin: 'global' and omit vizId.
const Luzmo = require('@luzmo/nodejs-sdk');
const client = new Luzmo({
  api_key: '< Your API key >',
  api_token: '< Your API token >'
});
client.create('authorization', {
  type: 'embed',
  username: '12345678',
  suborganization: 'Burrito Co.',
  name: 'Embed user',
  email: 'embed_user@example.com',
  expiry: '24 hours',
  filters: [
    {
        condition: 'and',
        origin: 'itemFilter',
        datasetId: ' < DATASET_ID > ',
        vizId: ' < CHART_ID > ',
        filters: [
          {
            expression: '? > ?',
            parameters: [
              {
                formula_id: ' < FORMULA_ID > ',
                dataset_id: ' < DATASET_ID > '
              },
              5
            ],
            properties: {
               type: 'having'
            }
          }
        ]
      }
  ]
}).then((result) => {
  // Embed key/token: result.id / result.token
  console.log(result);
});
Using an ad hoc aggregation formula as having filter
Below example sets an ad hoc aggregation formula as having filter on a certain chart. To set it on the entire dashboard, use origin: 'global' and omit vizId.
The example below does a count(column), to do a countr omit the column_id.
const Luzmo = require('@luzmo/nodejs-sdk');
const client = new Luzmo({
  api_key: '< Your API key >',
  api_token: '< Your API token >'
});
client.create('authorization', {
  type: 'embed',
  username: '12345678',
  suborganization: 'Burrito Co.',
  name: 'Embed user',
  email: 'embed_user@example.com',
  expiry: '24 hours',
  filters: [
   {
        condition: 'and',
        origin: 'itemFilter',
        datasetId: ' < DATASET_ID > ',
        vizId: ' < CHART_ID > ',
        filters: [
          {
            expression: '? > ?',
            parameters: [
              {
                column_id: ' < COLUMN_ID > ',
                dataset_id: ' < DATASET_ID > ',
                aggregation: { type: 'count' }
              },
              5
            ],
            properties: {
               type: 'having'
            }
          }
        ]
      }
  ]
}).then((result) => {
  // Embed key/token: result.id / result.token
  console.log(result);
});