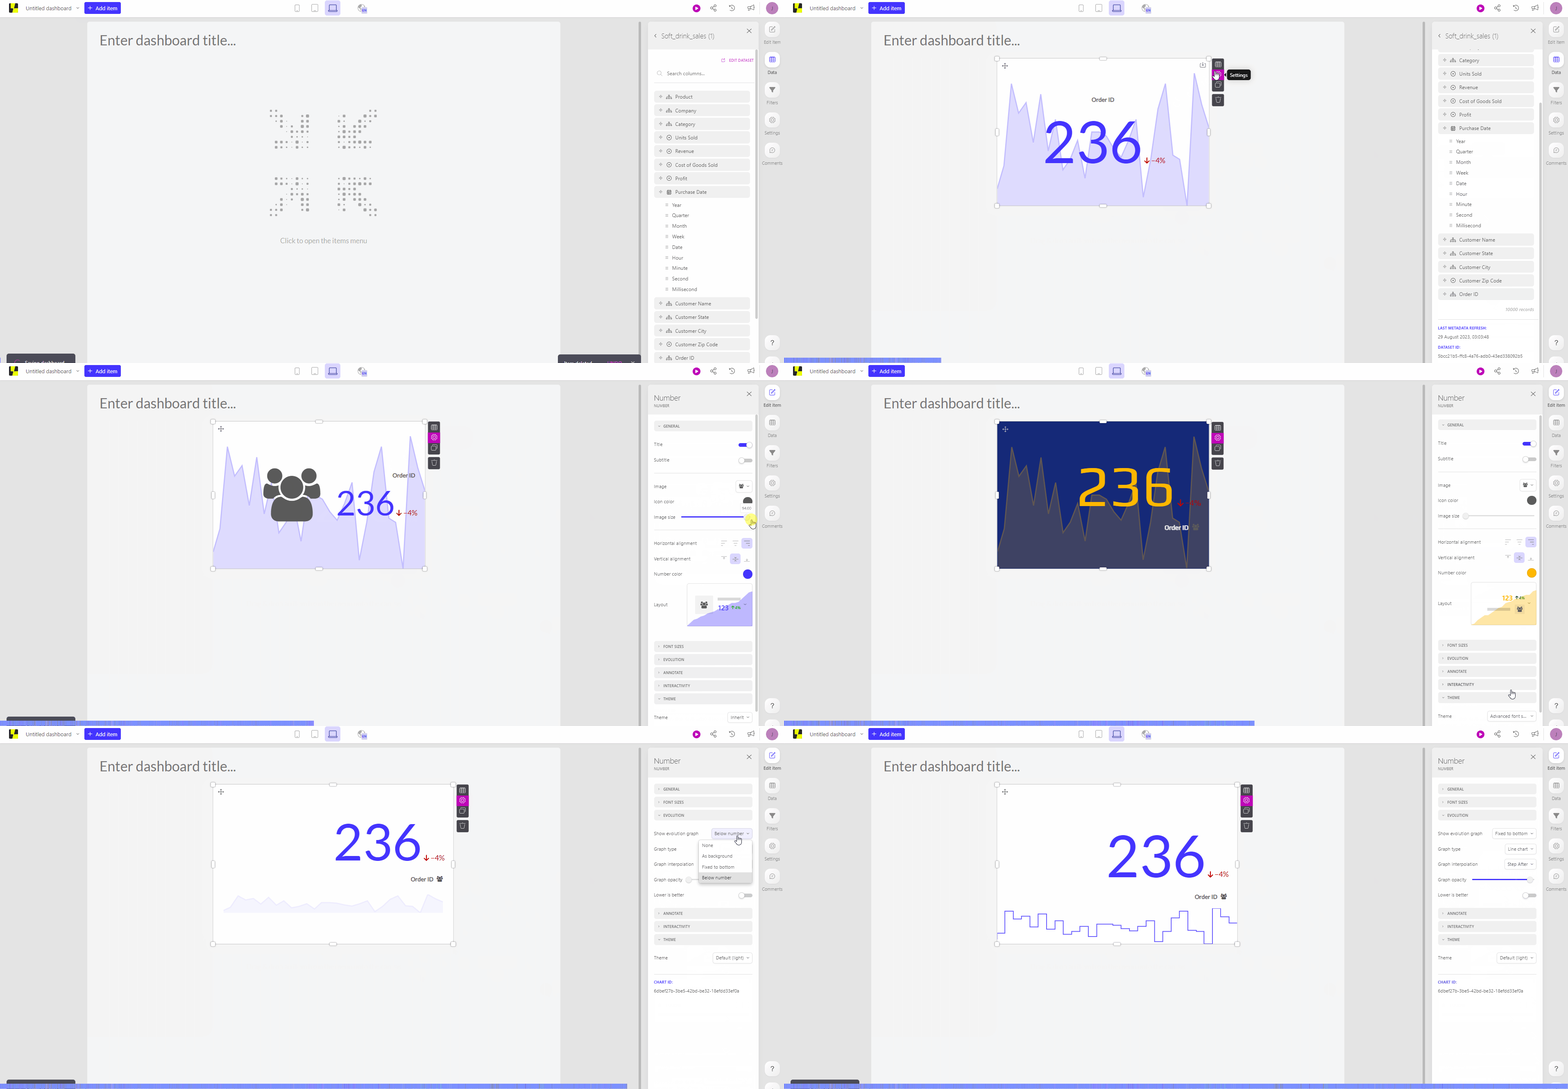
Number with evolution chart
Dashboards contain the main KPIs an organization needs to track. These are important numbers for which it could be desired to see the evolution compared to the previous time period.
That’s where the Number with evolution chart comes into play, to get a status update in a glimpse.
How to create the Number with evolution chart
The Number with evolution chart can be found underneath the General section, click on it or simply drag & drop into the canvas.

Measure slot
Add your desired column to the Measure slot.
By default, the sum of the values in that specific column will be displayed. You can easily change the aggregation to e.g. average via the slot menu settings. Here, you can also adapt the number format.
Evolution slot
Add a level from a date(time) column to the evolution slot to get insights in the evolution of your KPI in the last available time period compared to the time-period before that; make sure to choose the appropriate date-level based on your desired period you’d like to compare, e.g. the last available month compared to month before.
Three components of the number chart upon using this slot:
Main number - aggregated value for this time period e.g. this month
Percentage - evolution of value from this time period compared to the previous time period e.g. evolution this month compared to previous month. This utilizes the following calculation: (aggregated_value_last_period - aggregated_value_current_period) / aggregated_value_last_period
Evolution graph - visualizes the evolution of the aggregated values in a line or area chart
Tips and tricks
The Number with evolution chart has several styling possibilities to enhance the visual effect of the dashboard item. These can be found in the settings of the widget.
Include an emoji, icon or image
Change the alignment of your title
Adapt the main color of the Number with evolution chart (by default, this will use the main color of your dashboard theme)
Play around with the layout of the different parts
Separately modify the font size of the number or title
Fully customize the evolution graph
Decide whether a decrease of the evolution should be green or red
In case you have any questions left, feel free to reach out to us!