Route Map
A route map uses coordinates and time or order data in order to display routes on a map. Route color, width and opacity can be used to highlight specific attributes.
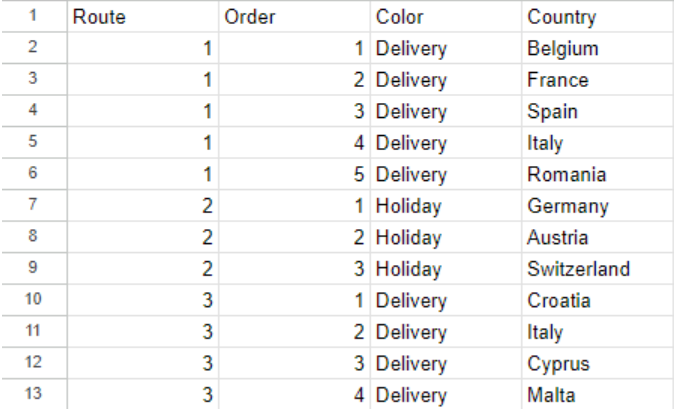
This is the simple dataset that is powering the map above:
How to create a Route Map
In Luzmo, creating a route map is straightforward. Click on add Item, then scroll to the ‘Maps’ section and select the Route Map from the map charts. Drag it onto your dashboard.
Upon selecting ‘data’ settings, you will be prompted to fill in four dataslots: coordinates, route, color and order. Let's explore each one:
Coordinates
For a route map, you need geographic coordinates (latitude and longitude) to trace your route accurately. Use Luzmo's public datasets with geographic columns or upload your own. You would need to have longitude and latitude columns in your dataset and create a Coordinates column from those, as explained in our academy article here.
While we recomment coordinates for this map type, topography data can also be used. However, please keep in mind that certain use cases (for example countries with multiple territories) may generate imprecise results, with the center of the topographical area being ouside of the main country area.
Route
After adding your coordinates, and linking it to your measure dataset if needed, you can just add your route column to the Route slot.
Colors
You can also add color differentiation by moving your category into the Color slot. That will help you with using your Categories to define how the data is grouped. The grouping will appear immediately on the map. You can change the legends position to accomodate your chart.
Order
You can add a measure to order by, using the Order slot.
Tips and tricks
Once you’ve added your data to the geography, route color and order slots, the route will populate the map. Customize the routes' color in the theme settings to match your dashboard's look. You can also change map style and other functions in the settings.
The route map allows you to customize the way the routes are displayed in terms of color and opacity.
Video Tutorial
Similar charts
The route map is quite unique in the way it displays information, as no other maps use routes in order to visualize relevant data points. More information about all available map types can be found here.
For a more complex Route map use case, please see this example dashboard that contains the data powering it, in a table at the bottom.